Case Studies
The story behind each project: what the problem was, how I approached it, and what came out of it.
-
 Data Science
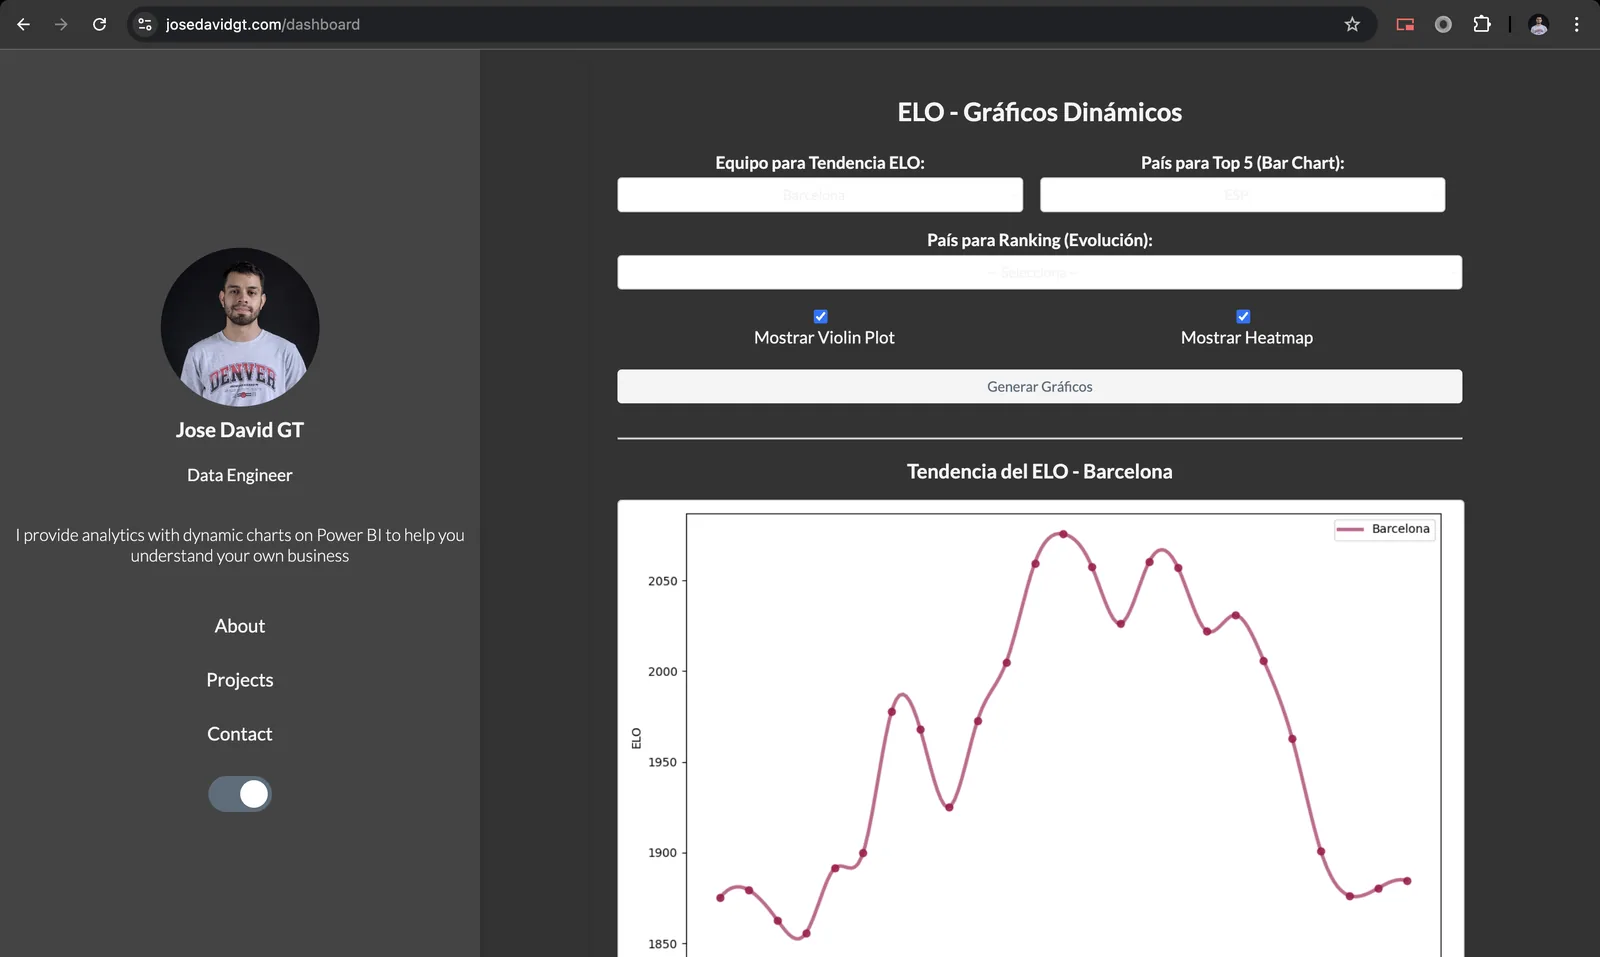
Football ELO Dashboard
25 years of club ELO ratings, five chart types generated on demand by a plotting microservice, and a GPT-4o button that explains what each chart shows.
- Python
- Flask
- pandas
-
 Web Development
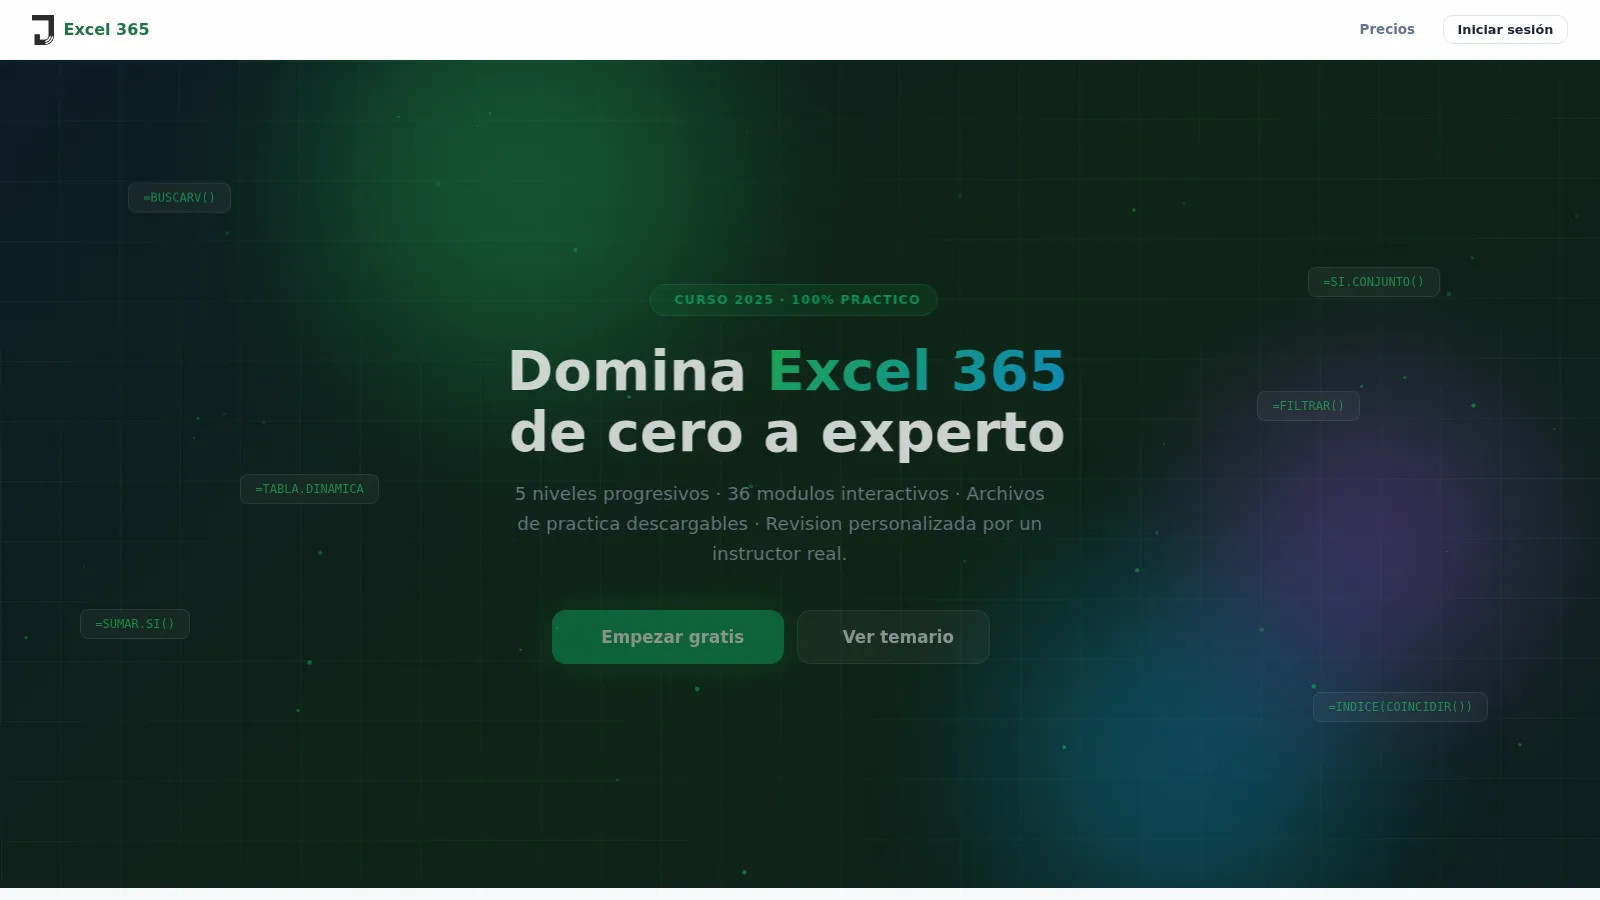
Excel 365 Course Platform
Instead of renting a course platform I built one: auth and storage on Supabase, checkout on Stripe, an admin panel to review student workbooks, and modules written as React components.
- Flask
- Supabase
- Stripe
-
 Web Development
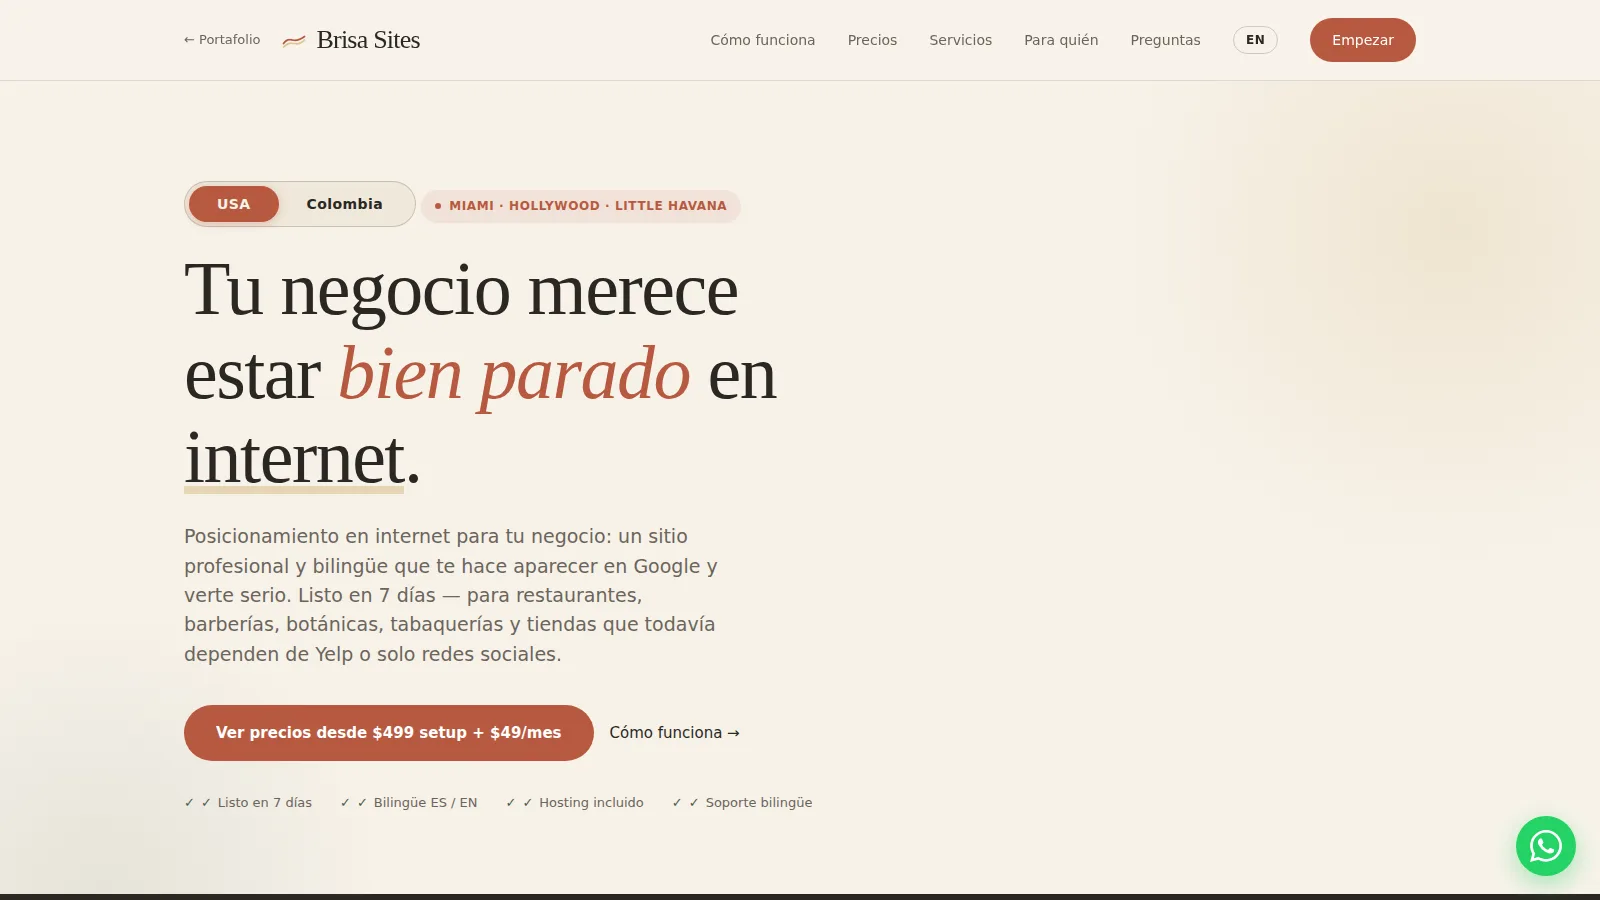
Brisa Sites
Six vertical landing pages, a bilingual ES/EN toggle, two regional price lists and a WhatsApp-first funnel — the business side of building websites.
- Next.js
- HTML/CSS
- SEO
-
 Data Science
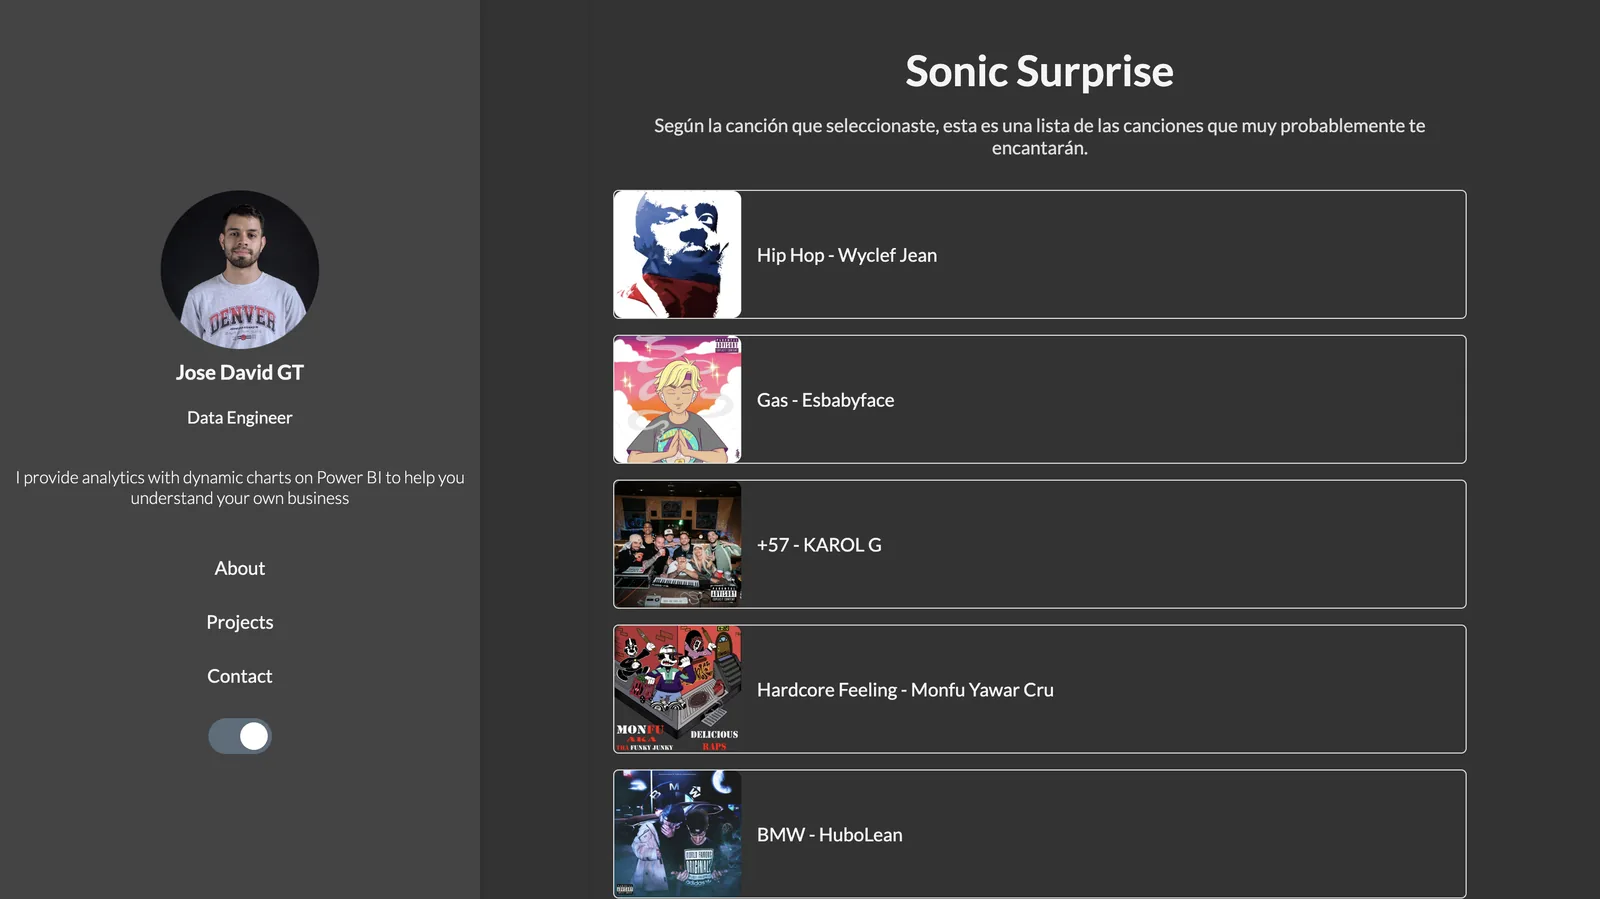
Sonic Surprise & Playlists Qualifier
What I learned shipping two tiny apps on top of third-party APIs — including what happens when the provider changes the rules and how to degrade gracefully.
- Python
- Flask
- Spotify API
-
 Web Development
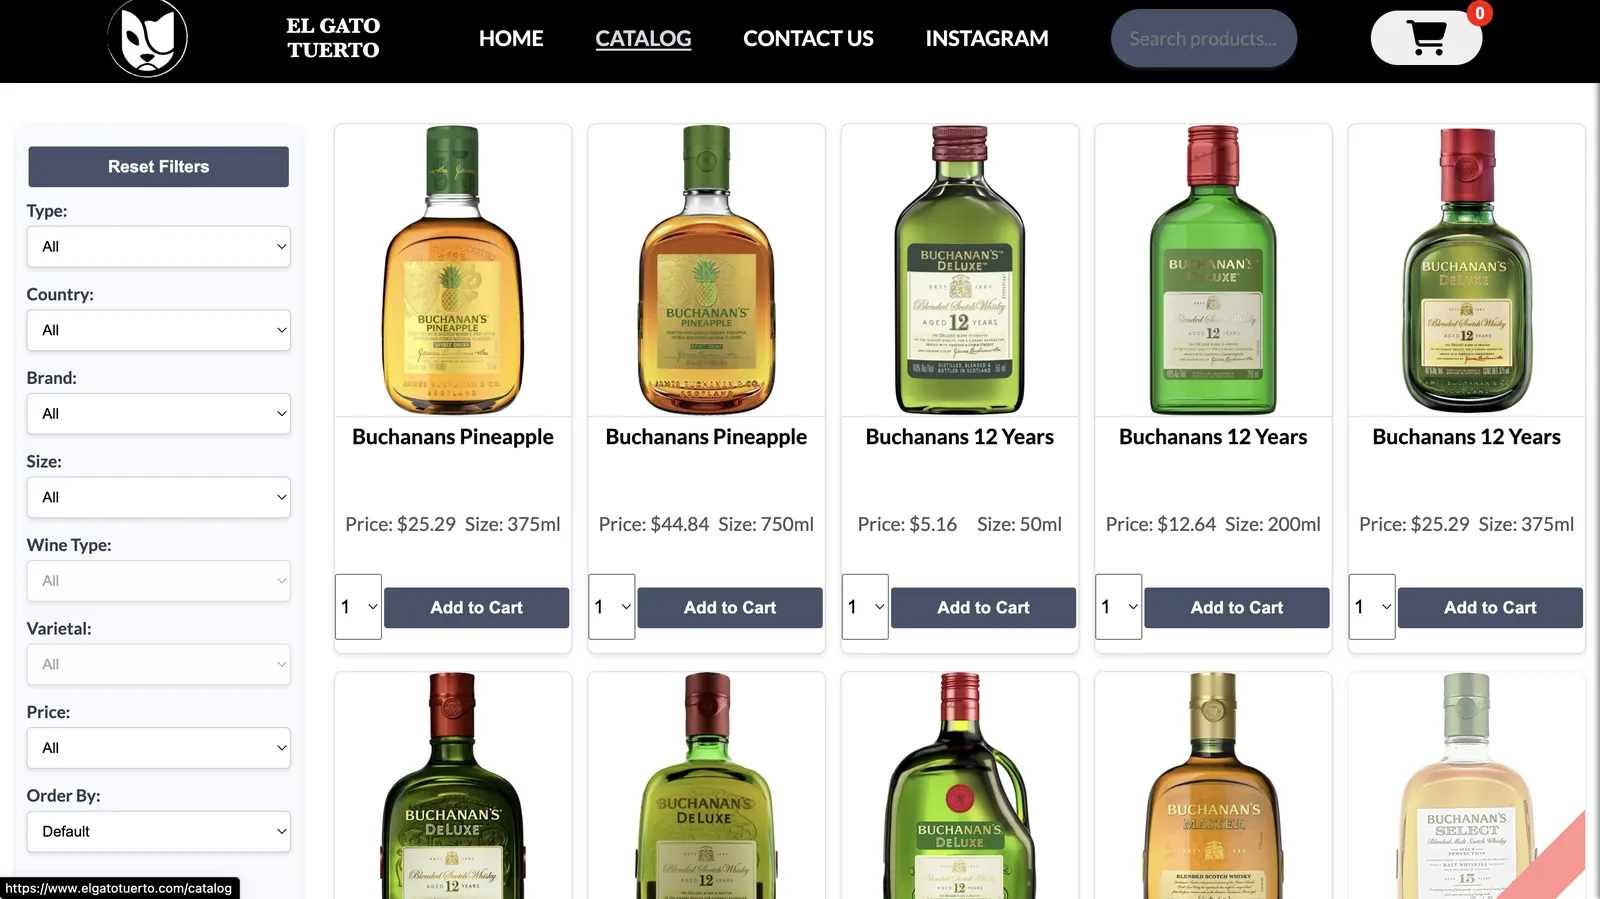
El Gato Tuerto — Liquor Store
How continuous feedback from the owner turned a simple catalog into a store with checkout, delivery integration and a marketing plan.
- React
- JavaScript
- MongoDB
-
 Data Science
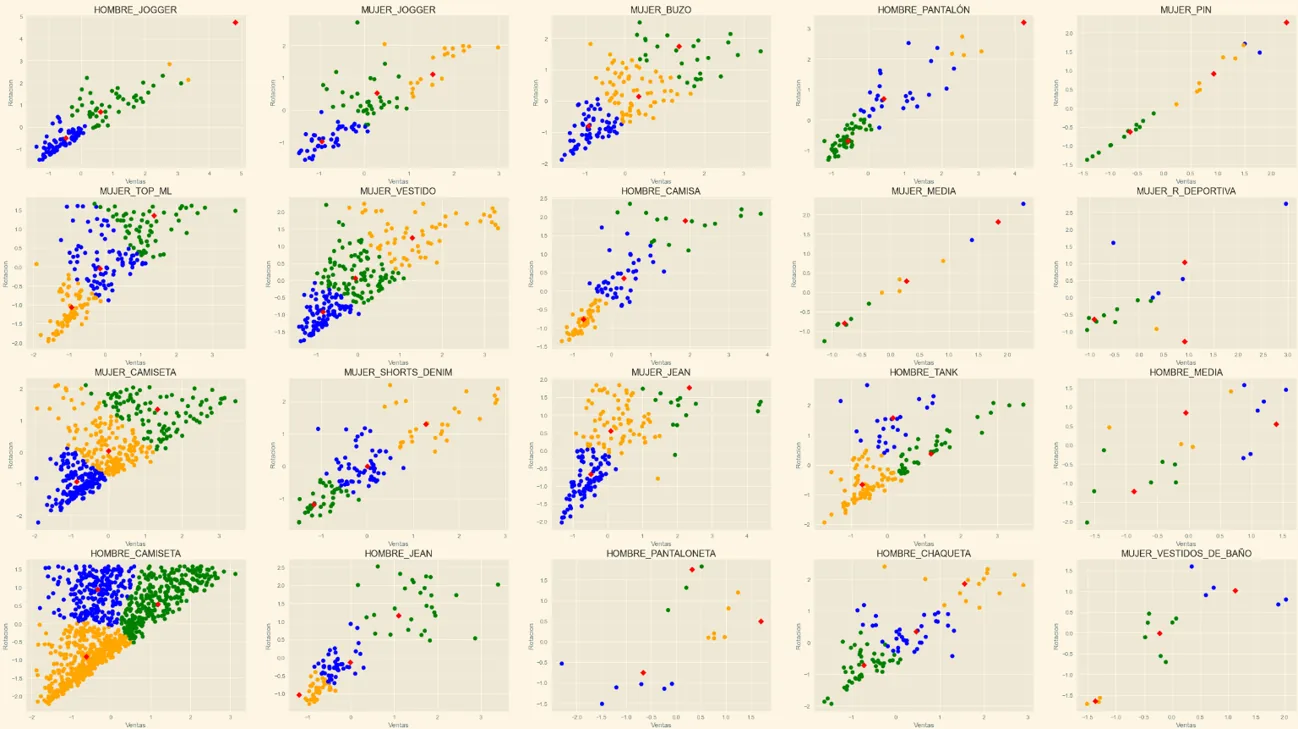
Item Classification with K-Means
Analysts rated every item by hand. A clustering model — and an uncomfortable conversation about the number of categories — reached 85% accuracy.
- Python
- scikit-learn
- Power BI
-
 Data Science
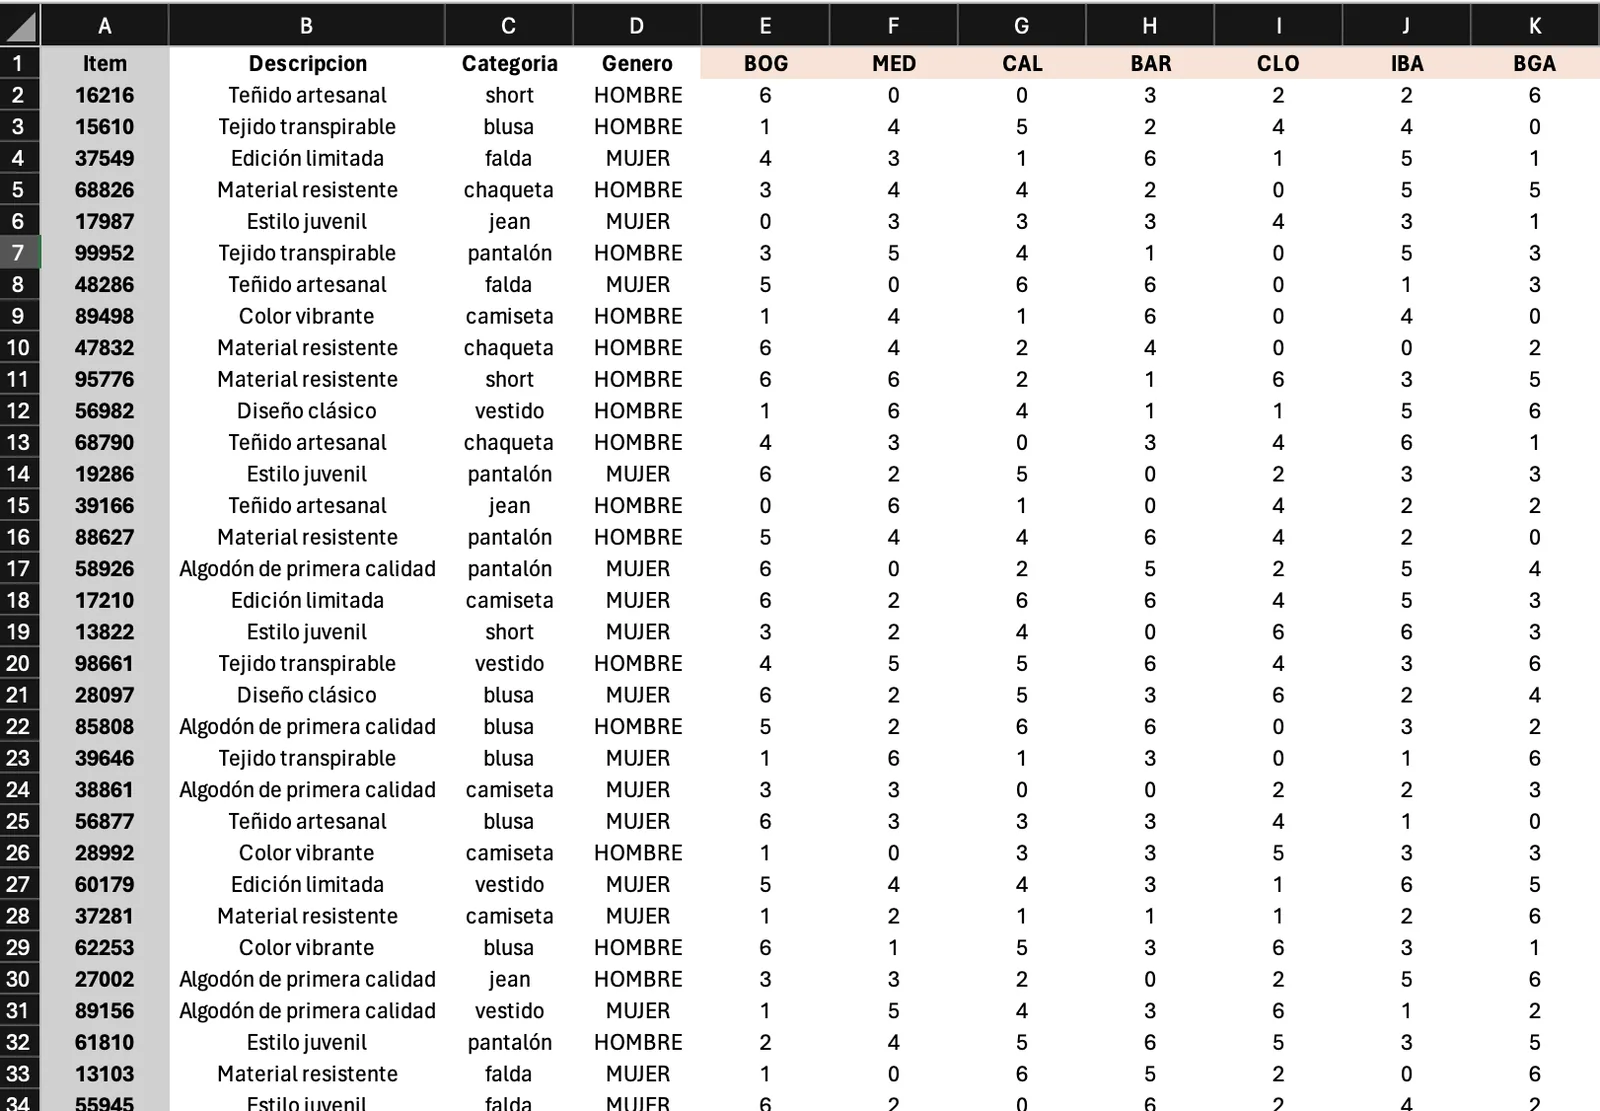
Surplus Distribution
Four analysts reviewed items one by one. A rotation-weighted metric and a store × item matrix cut the time spent on the task by 80%.
- Python
- pandas
-
Data Science
Rating Prediction Pipeline
Three scripts that merge shipments, master data and historical ratings, then train a neural network, a decision tree and KNN to predict item ratings.
- Python
- scikit-learn
- SQLAlchemy
-
 Mobile Development
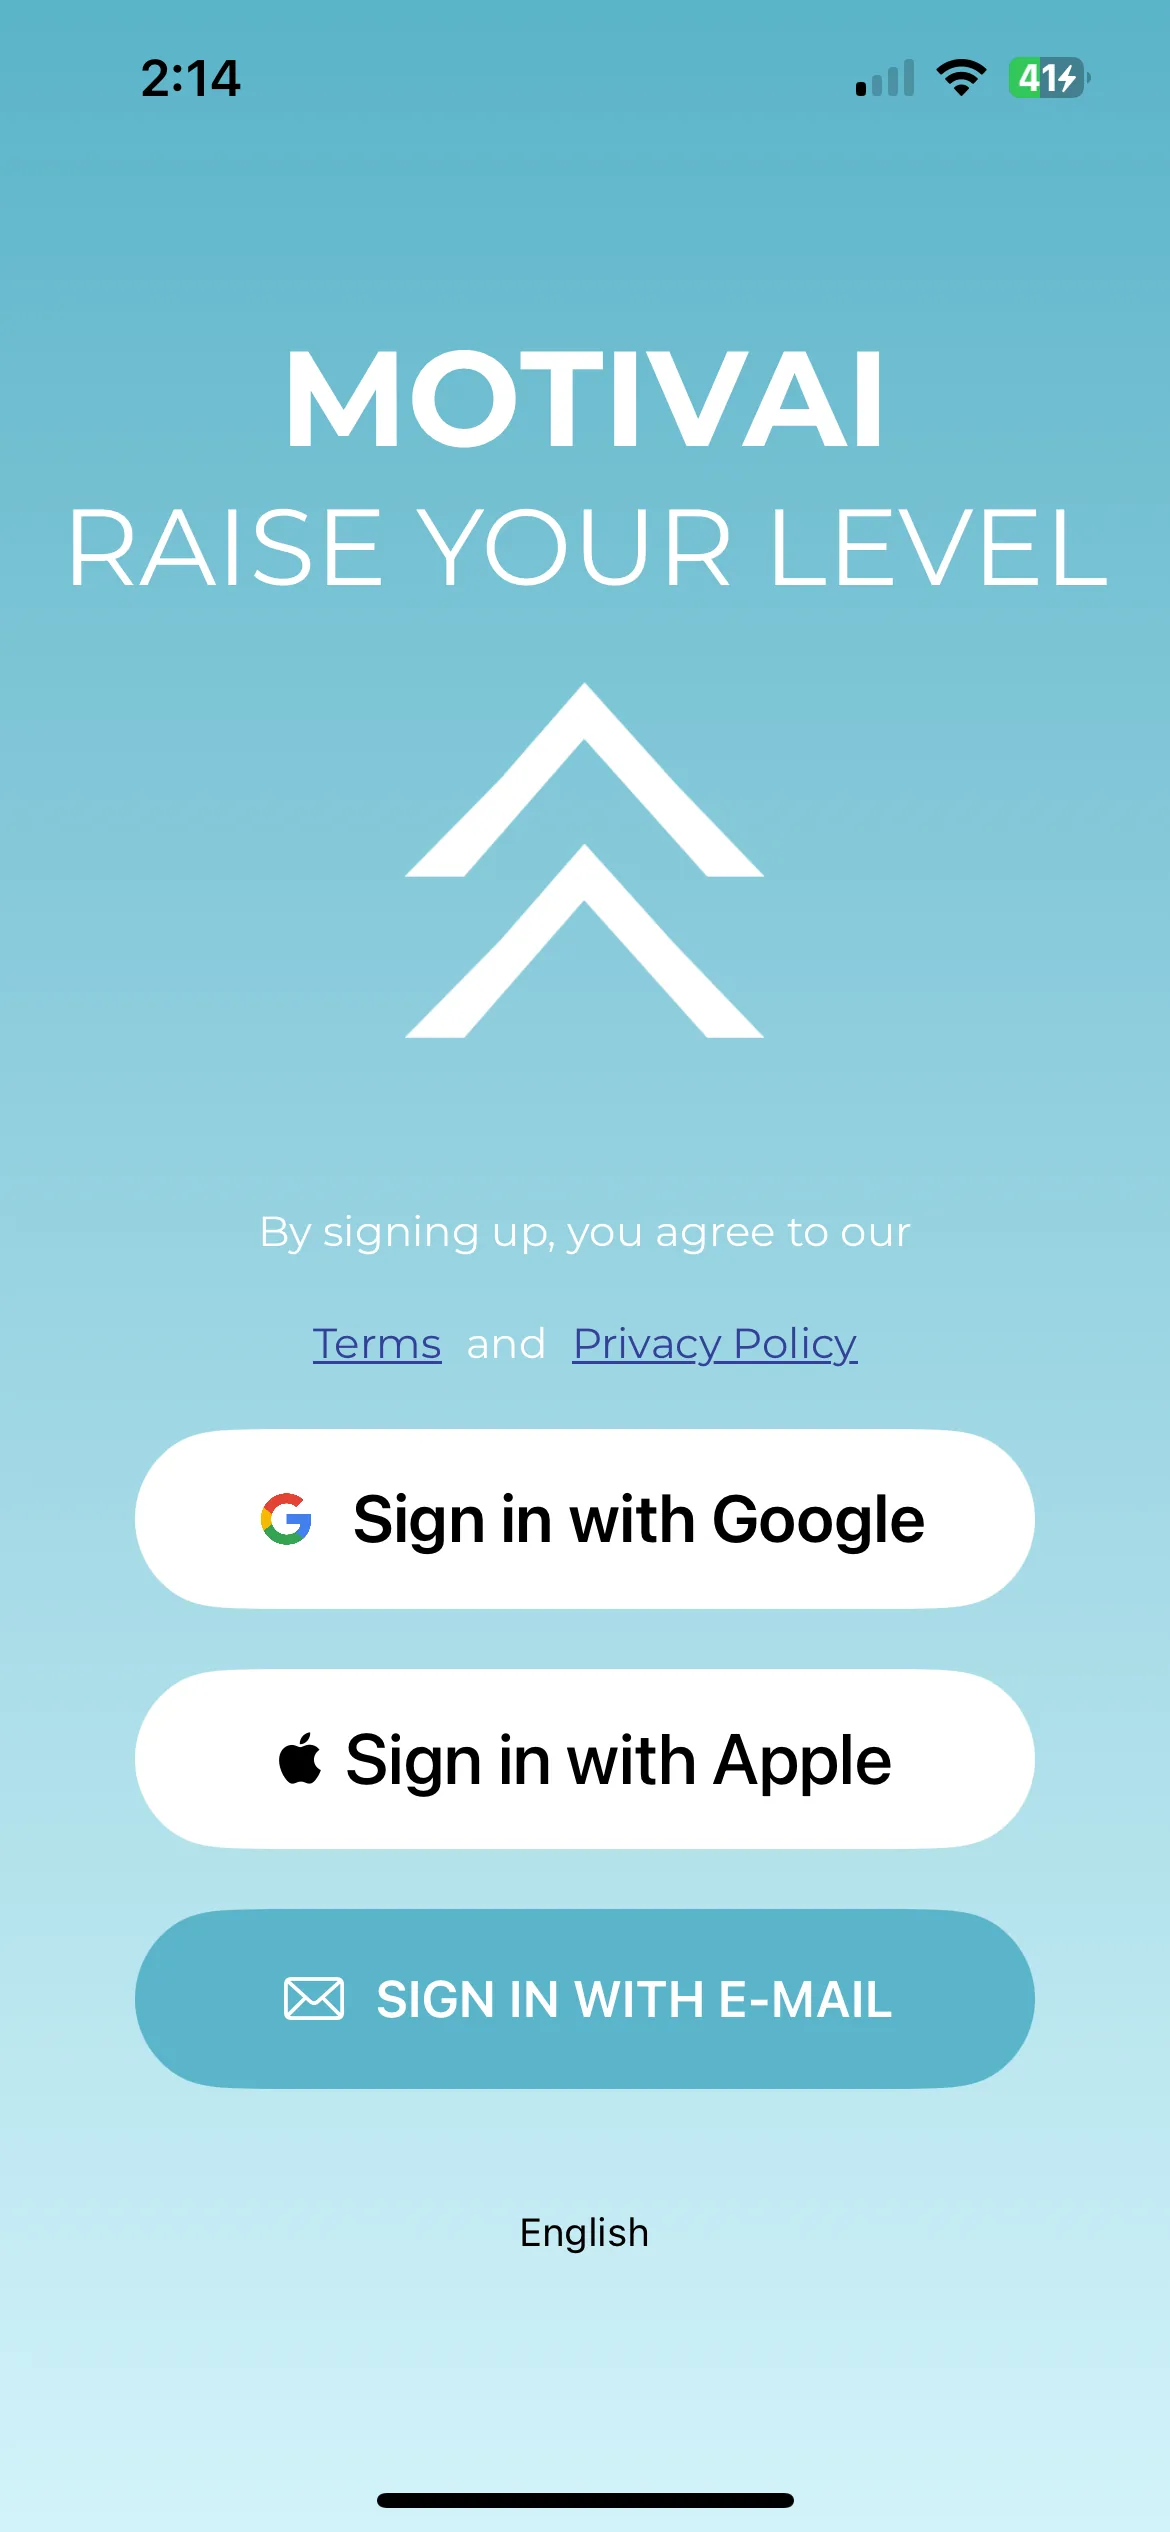
MotivAI
Built with two colleagues: onboarding with Firebase Auth, habit tracking, and a chatbot whose mood adapts to the user.
- Swift
- SwiftUI
- Firebase
-
 Mobile Development
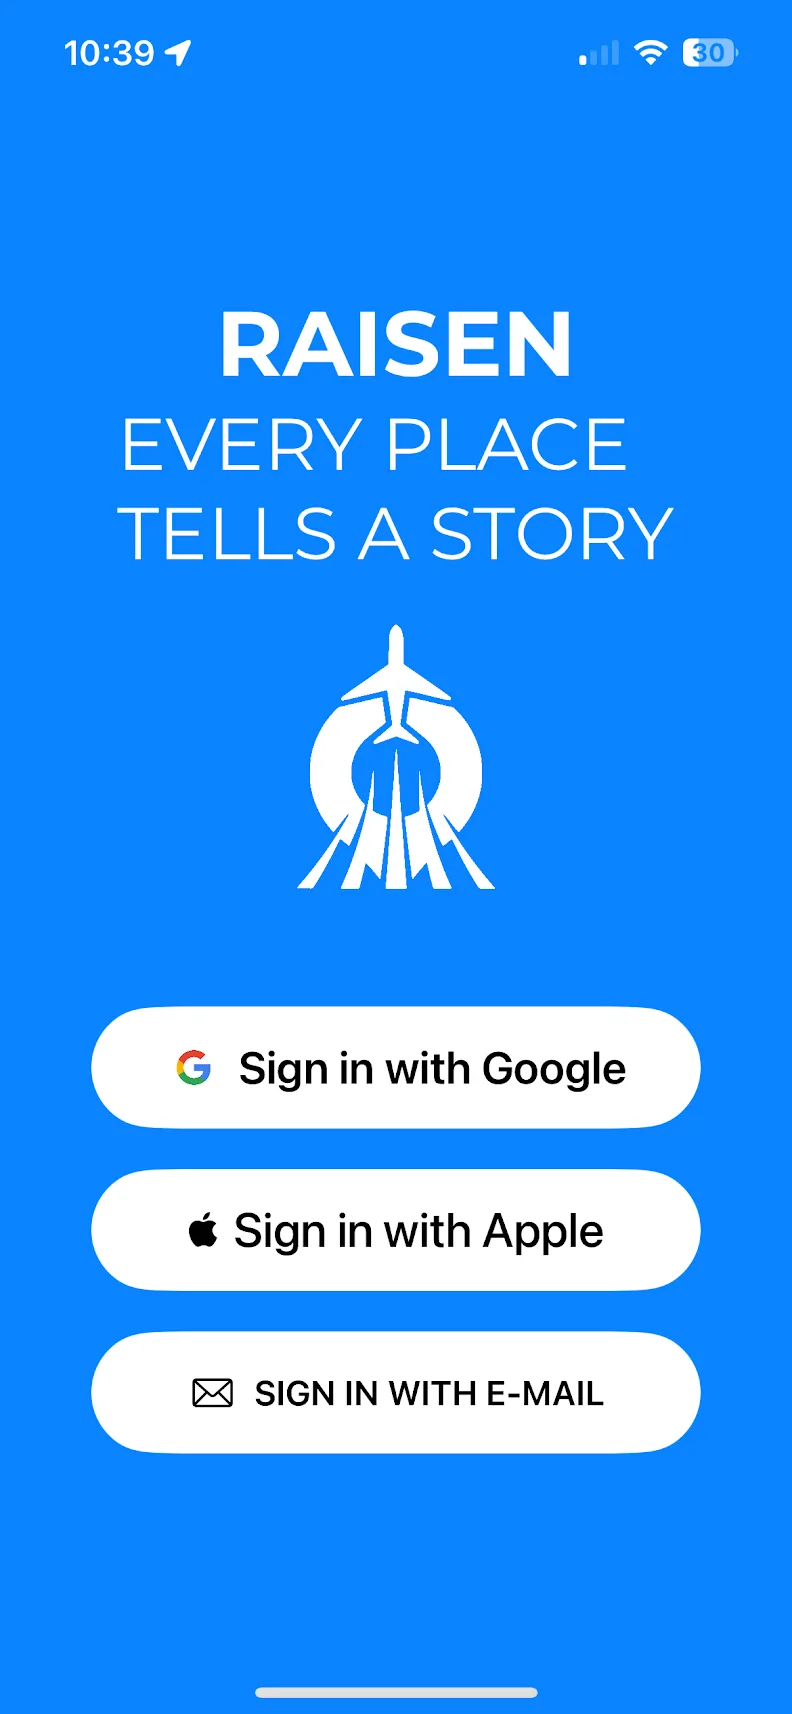
Raisen
A solo project: enter a city and a number of days, get a route with places, timings and images — plus a collage generator for wallpapers.
- Swift
- Firebase
- OpenAI
-
 Data Science
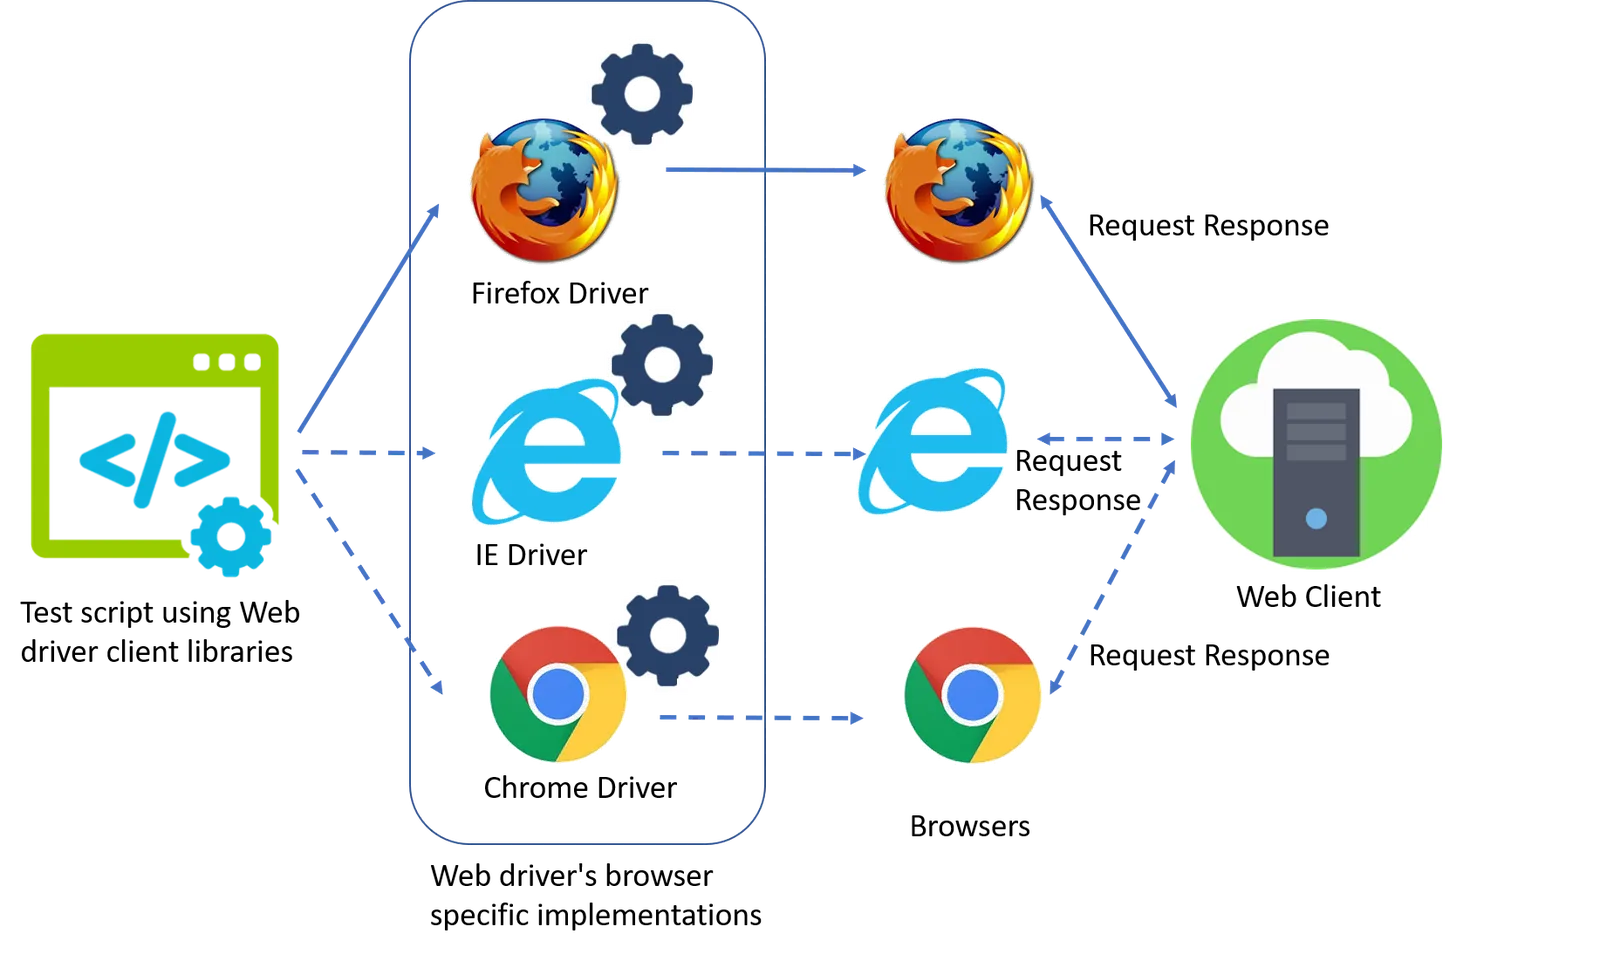
Web Scraping Toolkit
Scrolling catalogs, cleaning prices and automating logins on streaming services to build datasets ready for analysis.
- Python
- Selenium
- BeautifulSoup
-
 Data Science
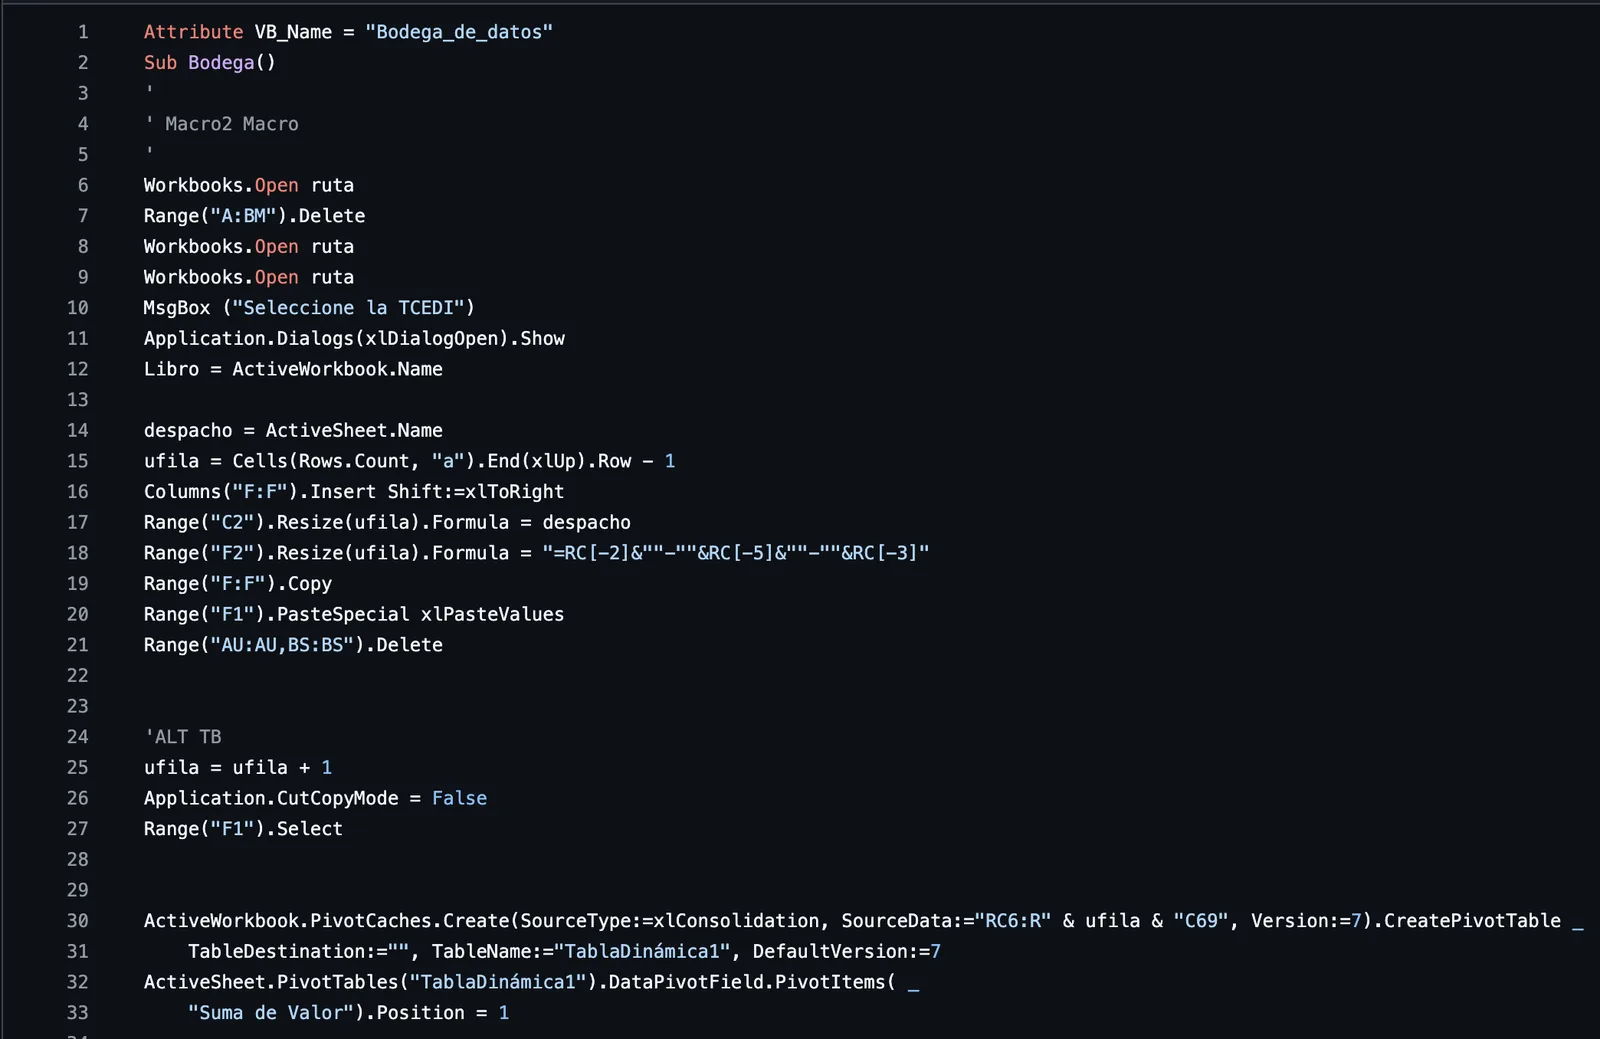
Excel VBA Macros for Inventory
Pivot tables, lookups and conditional formatting wired together in VBA to replace hours of manual inventory work.
- Excel
- VBA
-
 Web Development
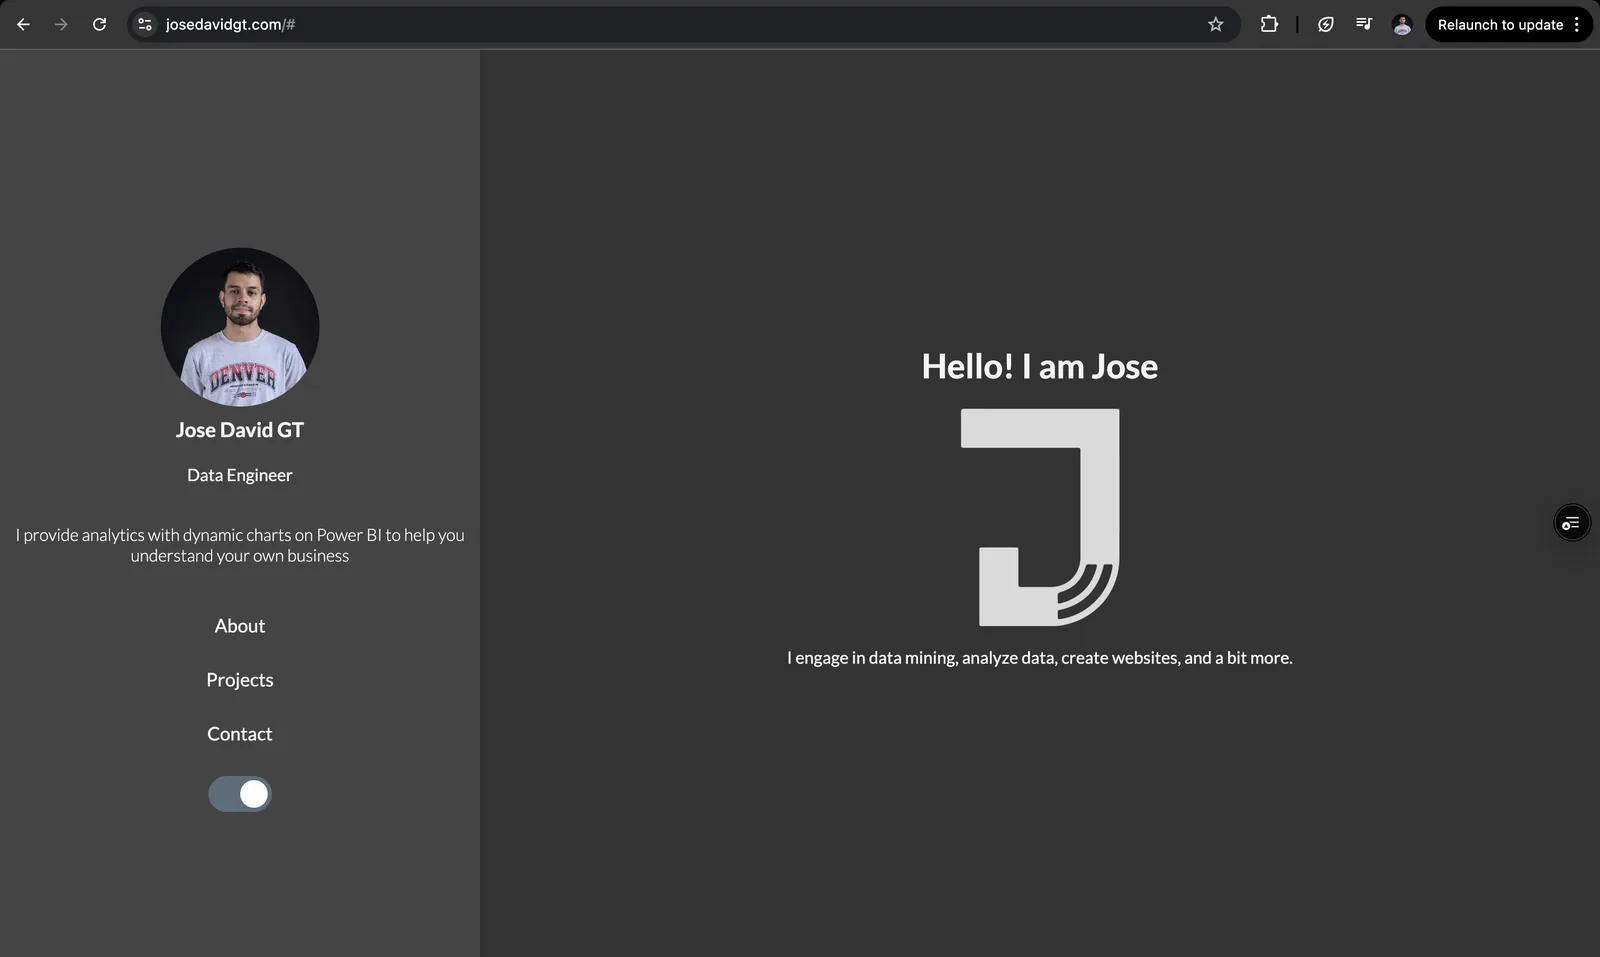
Building This Portfolio
Why the site went through five iterations, what each one taught me, and why server-side rendering won in the end.
- Flask
- Jinja
- React